research
data structures and software dependability
computer science department
brandenburg university of technology cottbus - senftenberg
Modelling epidemics / pandemics
latest update: March 03, 2022, at 04:06 PM
This webpage is developed by a collaborative project between
- Prof. David Gilbert, Brunel University London, and his team
- Prof. Monika Heiner, BTU Cottbus, and her team.
We provide a few basic models to explore how some key figures may influence an epidemic/pandemic process. We favour to represent our models as Petri nets, which can be read in different ways. Here we use the merely qualitative (time free) perspective. Only uncoloured Petri nets are supported and animated by help of Patty.
INDEX
- SIR model
- SIVR model = SIR + varus variant
- SIQR model = SIR + quarantine
- SIAR model = SIR + symptomatic vs asymptomatic
- SIXR model = SIR + vaccination
- SIR-S model = SIR + stratification
- P2-SIR model = SIR + travel
- Tools
- References
DISCLAIMER
- Models are as good as the assumptions they build on.
Some hints:
- A click on a picture opens a new window with a Petri net, directly executable in your web brower by help of Patty; nothing needs to be installed.
- Then, the PN can be animated by either
- clicking on individual transitions (boxes) or
- one of the smallish triangles in the control panel.
- Clicking on a place adds tokens, Shift+clicks remove tokens.
(1) SIR model
SIR model - Looking for some background? Check wikipedia first.
Basic assumptions:
- Getting infected and becoming infectious coincide.
- A recovered person will not get infected again.
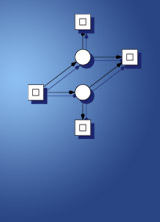
- the very basic SIR model
- the basic SIR model extended by a counter of the total infections over time
[[#SIVR]
(2) SIVR model
- an SIR model extended by a virus variant occurring delayed after the firing of Mutation.
(3) SIQR model
- an SIR model extended by quarantine, adding an alternative route to Recovered
(4) SIAR model
- an SIR model with symptomatic and asymptomatic compartments, giving rise to four different cases of infections
(5) SIXR model
- an SIR model extended by a vaccination regime two doses.
(6) SIR-S model - stratification
- SIR-S2 - variation of the SIR model describing stratification of a population into two age groups
- SIR-S20 - variation of the SIR model describing stratification of a population into 20 age groups; obtained by unfolding of a coloured Petri net, layout automatically generated.
Hint: chose automatic animation and be patient.
(7) P2-SIR model - travel
- Two countries, each of which is associated with a separate, but structurally identical SIR model, and linked by travel.
Remark: generalisation to arbitrary geographical networks is achieved by use of coloured Petri nets; see teaser [SRL+20b.sld].
Tools
This webpage builds on the following tools:
- Snoopy - construction of Petri Nets
- Patty - web-based (qualitative) animation of (uncoloured) Petri nets
- Charlie - structural analysis (conservativeness, invariants)
References
- [HGD08]
M Heiner, D Gilbert and R Donaldson:
Petri Nets for Systems and Synthetic Biology;
In SFM 2008, (M Bernardo, P Degano and G Zavattaro, Eds.), Springer, pages 215–264, 2008. [ pdf ] [ doi ] [ BibTeX ] - [Schu08]
Krispin Schulz:
An Extension of the Snoopy Software to Process and Manage Petri Net Animations (in German);
Bachelor thesis, BTU Cottbus, Dep. of CS, November 2008. [ pdf ] [ BibTeX ] - [SRL+20b.sld]
M Schwarick, C Rohr, F Liu, G Assaf, J Chodak and M Heiner:
Efficient Unfolding of Coloured Petri Nets using Interval Decision Diagrams - Teaser;
Talk, PETRI NETS 2020, Paris, June 2020. [ pdf ] [ BibTeX ]


